OVERALL GRADE
C+ Solid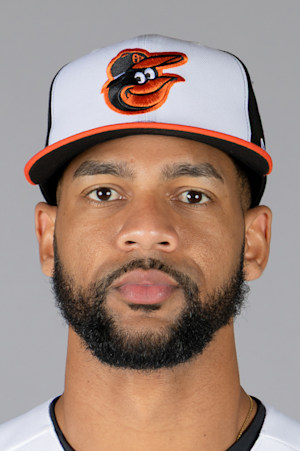
Photo unavailable
PLAYER PROFILE
Leody Taveras
Center Field • Right Field • Left Field • Third Base • Baltimore Orioles
Bats:
Switch
Throws:
Right
Age:
28
Height:
6' 2"
Weight:
210 lbs
COMPLETE BASEBALL EVALUATION
Player IQ
A role-aware evaluation of performance, history, durability, defensive responsibility, athletic value, decision-making proxies, and winning situational impact.
OVERALL PLAYER IQ
77 Out of 100BASEBALL ROLE
Outfielder
CF · Baltimore Orioles
Bats: Switch
Throws: Right
COMPLETE PLAYER READ
The evaluation on Leody Taveras
Leody Taveras currently grades as a solid baseball player in the Baseball IQ 4.3 model. The strongest supported category is Defense, Range and Arm Context (96/100), while Hitting Decisions and Pitch Recognition (75/100) is the clearest current improvement area. Recent official form is stable, and the final evaluation combines production, role, history, durability, decision-making proxies, defense, athletic value, and situational impact.
WHAT THE MODEL USES
- Official current production and league context
- Career excellence, experience, awards and postseason history
- Durability and workload history
- Verified defensive and multi-position usage
- Baserunning and athletic-performance proxies
- Role-specific decisions, pitch recognition, command and pitchability proxies
- Situational and recent-form evidence
STRONGEST VERIFIED AREAS
- Defense, Range and Arm Context
- Situational and Winning Impact
- Position and Role Value
DEVELOPMENT PRIORITIES
- Consistency
- Development Trend
- Hitting Decisions and Pitch Recognition
CATEGORY BREAKDOWN
Why the overall evaluation landed here
Last-X-games OPS (.633) is compared with the full-season OPS (.633).
Current Baseball Value
75
25th percentile context
Built from official MLB percentile context for OPS, OBP, SLG, average, power, and run creation.
Career Knowledge and Proven Impact
75
Career history includes 672 games, 512 hits, 49 home runs and verified postseason context. Official recognition includes 0 elite awards and 5 major awards or championship records across 7 supported entries. No verified MLB postseason hitting sample was available.
Consistency
75
Built from official game logs by comparing each appearance with the player's own per-game baseline.
Development Trend
75
Last-X-games OPS (.633) is compared with the full-season OPS (.633).
Position and Role Value
91
Based on the official primary role/position (CF) plus verified multi-position usage.
Durability
85
Built from official workload: 139 games and 482 plate appearances.
Hitting Decisions and Pitch Recognition
75
25th percentile context
Uses official walk rate, strikeout rate, and on-base context to explain how often the hitter controls plate appearances.
Defense, Range and Arm Context
96
Built from official fielding positions, innings, and verified multi-position usage.
Athleticism and Baserunning Decisions
90
Uses official stolen-base volume, success rate, and triples as a public baserunning proxy.
Situational and Winning Impact
96
Compares the official RISP OPS (.863) with the full-season OPS (.633).
Accuracy safeguard — IQDugout does not invent Leadership and clubhouse impact, Confidence and mental toughness, Unpublished private scouting measurements, Private clubhouse and leadership evaluations when verified evidence is unavailable. Those areas remain clearly labeled rather than receiving false precision.
2026 HITTING
Hitting Statistics
AVG
.219
Would rank #123
Top 91% vs qualifiers
Hits divided by at-bats.
OBP
.288
Would rank #126
Top 93% vs qualifiers
Rate of reaching via a hit, walk, or hit-by-pitch in official OBP opportunities.
SLG
.345
Would rank #130
Top 96% vs qualifiers
Total bases per at-bat.
OPS
.633
Would rank #131
Top 97% vs qualifiers
On-base percentage plus slugging percentage.
HR
8
#251 MLB
Top 38%
RBI
56
#138 MLB
Top 21%
H
94
#177 MLB
Top 27%
SB
11
#91 MLB
Top 14%
VERIFIED CAREER CONTEXT
Player Career Hub
Loading verified career and award records…
UNDERSTAND THE PLAYER
Scout Report
ARCHETYPE
Outfielder
Available current-season rate statistics are compared directionally with the qualified MLB hitter pool. These are not official rankings.
DATA CONFIDENCE
Moderate confidence
Compared with qualified MLB hitters, but this is not an official qualified ranking.
STRENGTHS
Verified indicators
- Multi-Position Experience
NEEDS IMPROVEMENT
Areas to monitor
-
Slugging Production Directional comparison
Why: Directional comparison (482 PA across 139 games): .345 SLG would place #130 against 135 qualified MLB hitters (4th percentile). This is not an official rank.
-
On-Base Production Directional comparison
Why: Directional comparison (482 PA across 139 games): .288 OBP would place #126 against 135 qualified MLB hitters (7th percentile). This is not an official rank.
-
Batting Average Production Directional comparison
Why: Directional comparison (482 PA across 139 games): .219 AVG would place #123 against 135 qualified MLB hitters (9th percentile). This is not an official rank.
VERSATILITY
Broad multi-position usage
- Primary role or position
- Center Field
- Position / role entries
- 4
- Verified secondary positions
- Right Field, Left Field, Third Base
This report summarizes available 2026 MLB statistics and official position information and available season usage. Non-qualified comparisons are directional, not official leaderboard ranks. Percentiles are calculated by IQDugout from official MLB comparison pools. Confidence reflects sample size, qualification, and supported comparison coverage. Versatility labels summarize verified position usage and are not league benchmarks. This is a current-data evaluation, not a projection.